
I think anybody the has had a population genetics course at university has heard of STRUCTURE
The program structure is a free software package for using multi-locus genotype data to investigate population structure. Its uses include inferring the presence of distinct populations, assigning individuals to populations, studying hybrid zones, identifying migrants and admixed individuals, and estimating population allele frequencies in situations where many individuals are migrants or admixed. It can be applied to most of the commonly-used genetic markers, including SNPS, microsatellites, RFLPs and AFLPs.
It has an option to have the package with a graphical front end – user friendly – or not. UNIX and Mac OS X operating systems are compatible with either of these, however if wanting to use STRUCTURE with Windows 10 you would need to use it without the graphical front end.
It should also be said that some of the links to sample data sets are no longer available.
fastSTRUCTURE was developed in order to work with large SNP data sets, which is the output of GBS.
fastStructure is an algorithm for inferring population structure from large SNP genotype data. It is based on a variational Bayesian framework for posterior inference and is written in Python2.x. Here, we summarize how to setup this software package, compile the C and Cython scripts and run the algorithm on a test simulated genotype dataset.
Although, I found the information given in the fastSTRUCTURE site not to be very clear and this review RE difficulties was helpful.
I am using STACKS for the processing of my raw GBS data. The populations program has the option for the output file to be in STRUCTURE format, which fastSTRUCTURE can use. This format needs some work before if can be run with fastSTRUCTURE.
STACKS populations STRUCTURE output file:
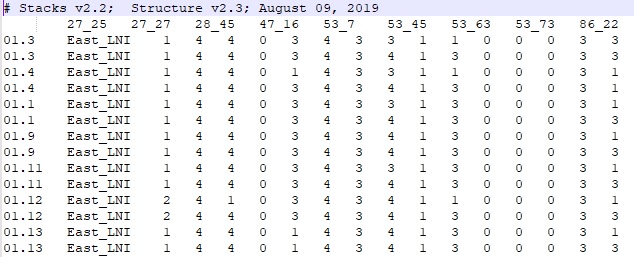
- Column 1: Individual ID
- Column 2: Location of collection
- Column 3-n: SNP data
Numbers 1-4 each represent A,T, C and G, respectively and 0 is missing data.
Specifically, rows in the data file correspond to samples, with two rows per sample (note that only diploids are handled by this software), and columns correspond to SNPs. The first 6 columns of the file will be ignored; these typically would include IDs, metadata, etc. This software only handles bi-allelic loci. The two alleles at each locus can be encoded as desired; however, missing data should be encoded as `-9′.
Also, there must be no headers! Excel or R can help you with a quick fix, so that your data ends up looking like this:
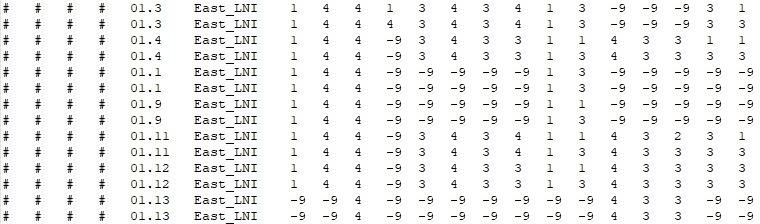
- Column 1-6: Metadata
- Column 7-n: SNP data
I have removed the header, added 4 ‘#’ columns to the front and replaced the ‘0s’ with ‘-9’. The # columns can contain any other information you may want, but ultimately you likely to have this in another file already so just add a placeholder to the columns. Save the new file as a tab delimited text file. Rename this file – example_name.str
You will also most likely want to add the location of collection of each sample for the visualization of the structure. So copy columns 3 and 4, remove duplicated data – STRUCTURE requires two rows per sample and so the population information required must be one location per individual. Remove column 3 and save as tab delimited text file – example_popmap.
Script options for stucture.py:
Usage: python structure.py
     -K <int>   (number of populations)
     --input=<file>   (/path/to/input/file)
     --output=<file>   (/path/to/output/file)
     --tol=<float>   (convergence criterion; default: 10e-6)
     --prior={simple,logistic}   (choice of prior; default: simple)
     --cv=<int>   (number of test sets for cross-validation, 0 implies no CV step; default: 0)
     --format={bed,str} (format of input file; default: bed)
     --full   (to output all variational parameters; optional)
     --seed=<int>   (manually specify seed for random number generator; optional)
Probably the most important thing here is to remember to say you are using str format, if not it will not be able to run the script as it will be looking for PLINK files. The next is the input, unlike normal scripts you do not specify the extension.
e.g. –input=example_name
The same goes for the output, you need only specify what the results files name should begin with and fastSTRUCTURE will further description to each file it outputs – .log, .meanP, .meanQ, .varP and .varQ.
e.g. –output=example_name_results
To view the admixture proportions:
$ python distruct.py

Here is how you can use this script

Usage: python distruct.py
     -K <int>  (number of populations)
     --input=<file>  (/path/to/input/file; same as output flag passed to structure.py)
     --output=<file>   (/path/to/output/file)
     --popfile=<file>  (file with known categorical labels; optional)
     --title=<figure title>  (a title for the figure; optional)
As suggested in the fastSTRUCTURE guide, your structure.py output now becomes the input.
e.g. –input=example_name_results
Here is where you add the population file you created.
e.g. –popfile=example_popmap
